WSWA’S NEW SCORECARD OPENS UP PRICE PERFORMANCE DATA FOR YEAR TO FEBRUARY 2022
The Wine & Spirits Wholesalers of America (WSWA) has introduced a new scorecard as part of its SipSource service based on price tier performance (PTP) across on- and off-premise wine and spirits channels.
The scorecard is designed to allows users to navigate the retail marketplace which has had a bumpy ride since the pandemic began. Specifically, WSWA says the new service can “more accurately pinpoint competitive market positioning”.
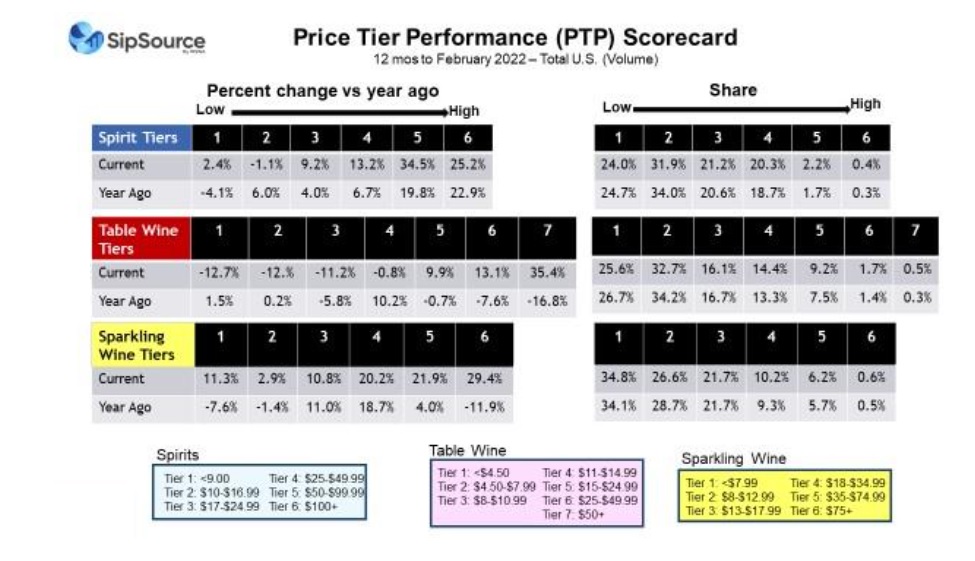
The first SipSource PTP scorecard analyses price tier data and trends in the 12 months to February 2022 versus the same period a year earlier, and examines category growth and consumer spending habits, including the impact of inflation on that spending.
WSWA: volumes are less than $17/bottle, but growth is in higher tiers
Not surprisingly for spirits, the two lowest price tiers ($9.99 or less, and $10-$16.99 per 750ml bottle) account for 56% of volume and are relatively stable in terms of growth versus a year ago.
For table wine, the three lower price tiers (collectively less than $11 per 750ml) account for almost 75% of the category’s volume, though all three price tiers are currently declining at double-digit levels. “Twelve-month comparisons through February 2022 versus the year prior still include the loading that started when Covid directives had a significant impact on consumer behaviours,” said SipSource analyst Danny Brager.
He added: “As the comps start to move beyond that period, it’s likely that volume decreases will begin to moderate. On the other hand, higher-end table wine price tiers declined through most of 2020, creating relatively easier comps for the current 12-month period, so we expect some moderation of the very large growth rates we’re seeing currently. But, we expect the higher end will still be the centre of growth.”
For sparkling wine, the PTP scorecard is strong, with growth across all price tiers, but above 20% in the top three: Tier 3 ($18 –$34.99) was 20.2%; Tier 4 ($35 -$74.99) was 21.9%; and Tier 5 ($75 was 29.4%). “However, we anticipate that growth at the higher end will moderate somewhat,” Brager said.
Bracing for inflation
Inflationary pressures may have some impact on premiumisation trends. “Depending on the portfolio of any individual supplier or importer, this represents either a very positive or negative story,” according to Brager.
He said: “If you’re operating in a segment and price tier with strong growth, the wind is at your back, and you can assess if you’re keeping pace with the gains. But if you’re in a segment and price tier with negative trends, the headwinds could be significant.”
However, any players that are growing in that latter case, can stand out from the crowd as ‘positive exceptions’, a position that can be leveraged to good effect. Brands need to determine both the size of the prize and the trend associated with the segments and price tiers they operate within, so that they can assess their relative performance.
Reading the WSWA SipSource PTP scorecard
WSWA claims that SipSource is the drinks industry’s most comprehensive data source for price tier performance and shifts – based on distributor depletion data across both on-and off-premise channels in the US.
The new PTP scorecard provides comparisons of price tier share and volume trends for both the current 12-month period and the same period a year ago in order to discover: 1. whether you are keeping pace with category/segment trends in various channels and geographic areas, within various price tiers, and 2. where to focus and/or invest and where to hold back.
“The real magic and application is drilling down to more granular levels,” said Brager. “For example, in the luxury price tier, volume share for spirits overall might be relatively low, but it’s much higher for certain segments like Tequila, Scotch, and Cognac. How does that look further into individual channels and sub-channels or by geographic areas across the country?”
How far down brands want to explore the data is their choice. WSWA’s SipSource says that by looking at just the latest three months, companies can determine whether a trend is getting better or worse over that shorter period of time compared to the longer 12-month trend and fine-tune their strategies accordingly.
Join us at SIAL Paris as exhibitor Join us at SIAL Paris as visitor